Fig. 4
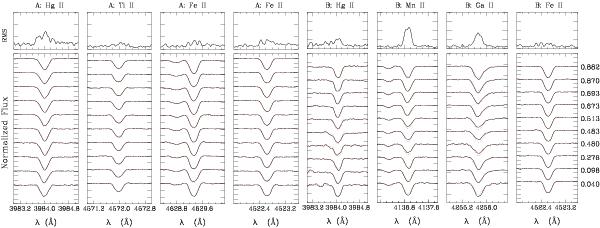
Line-profile variations and the rms values in the spectra of both components of 41 Eri over the rotation period. The dotted line corresponds to the mean line profiles. The scales for the normalised flux have ticks of 0.1 in the lower panels and 0.01 in the upper panels, respectively.
Current usage metrics show cumulative count of Article Views (full-text article views including HTML views, PDF and ePub downloads, according to the available data) and Abstracts Views on Vision4Press platform.
Data correspond to usage on the plateform after 2015. The current usage metrics is available 48-96 hours after online publication and is updated daily on week days.
Initial download of the metrics may take a while.