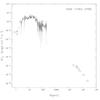
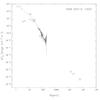
Fig. 5
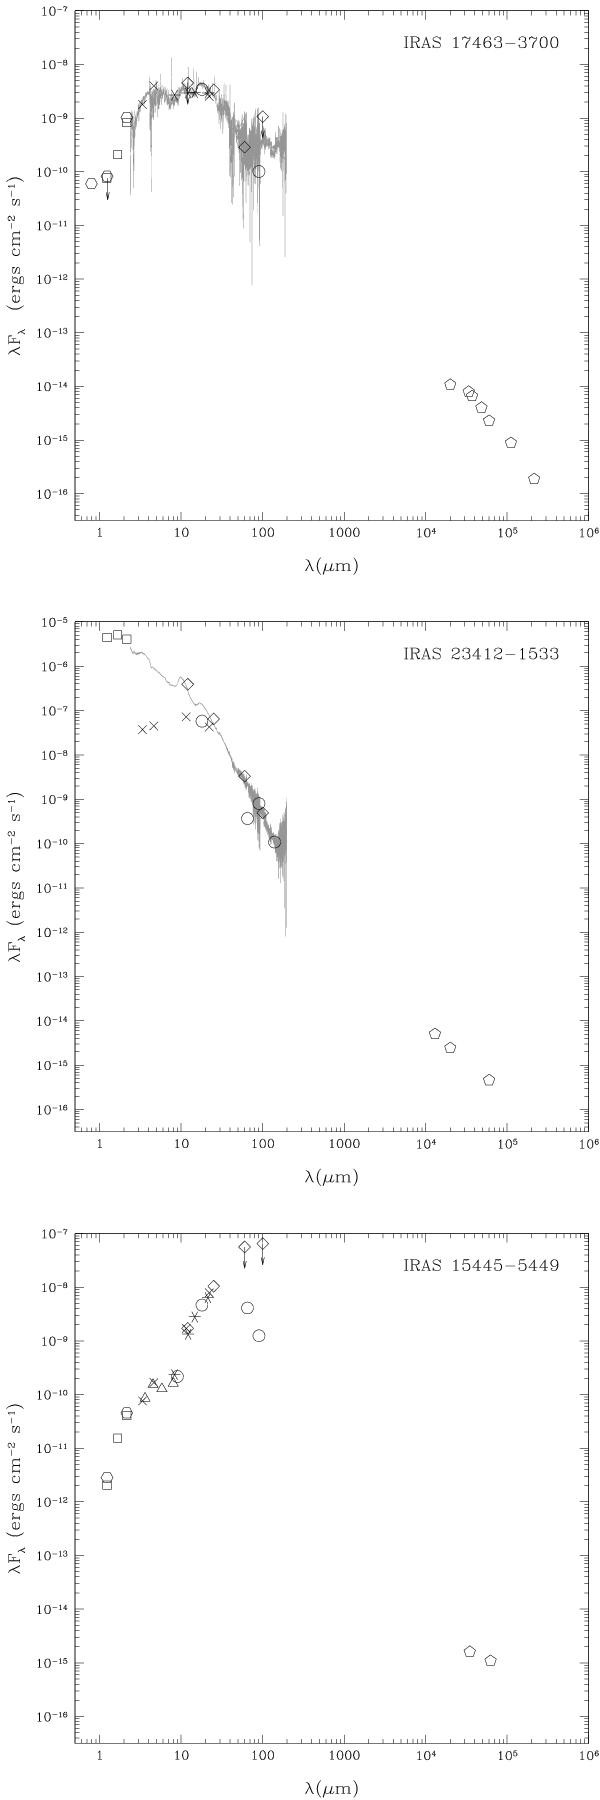
SEDs of some of the related objects. Symbols mean the same as in Fig. 3. The ISO spectrum is shown in gray when available. The flux densities of radio continuum in the two sources were measured by the following authors: IRAS 17463−3700 (Purton et al. 1982; Aaquist & Kwok 1991; Condon & Kaplan 1998), IRAS 23412 − 1533 (Sopka et al. 1982), and IRAS 15445 − 5449 (Bains et al. 2009).
Current usage metrics show cumulative count of Article Views (full-text article views including HTML views, PDF and ePub downloads, according to the available data) and Abstracts Views on Vision4Press platform.
Data correspond to usage on the plateform after 2015. The current usage metrics is available 48-96 hours after online publication and is updated daily on week days.
Initial download of the metrics may take a while.