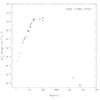
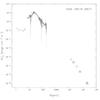
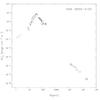
Fig. 3
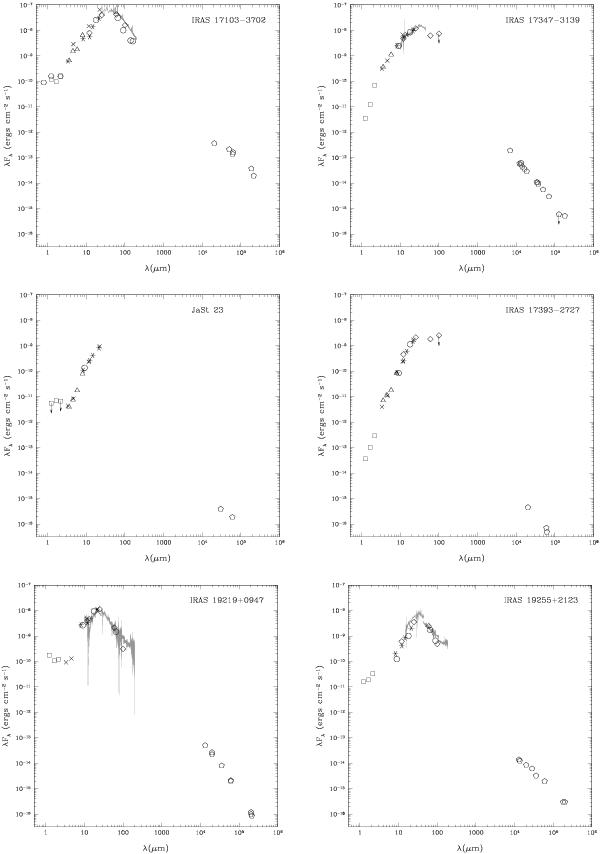
SEDs of the confirmed OHPNe. The hexagons, squares, triangles, crosses, asterisks, circles, and diamonds represent the DENIS, 2MASS, Spitzer, WISE, MSX, Akari, and IRAS data, respectively. The pentagons represent measurements at different radio wavelengths. The ISO spectrum is shown in gray when available. The arrows indicate an upper limit value. The flux densities of radio continuum in the different sources were measured by the following authors: IRAS 17103−3702 (Rodríguez et al. 1985; Payne et al. 1988), 17347−3139 (Gómez et al. 2005; Tafoya et al. 2009), JaSt23 (Van de Steene & Jacoby 2001), IRAS 17393-2727 (Pottasch et al. 1987, this paper), IRAS 19219−0947 (Seaquist & Davis 1983; Christianto & Seaquist 1998; Condon & Kaplan 1998), and IRAS 19255+2123 (Aaquist & Kwok 1991; Miranda et al. 2001; Gómez et al. 2009). The Spitzer fluxes for IRAS 17103 − 3702 (triangles) and J, H, K fluxes (squares) for IRAS 17393-2727 were measured by Phillips & Ramos-Larios (2008) and Ramos-Larios et al. (2012), respectively.
Current usage metrics show cumulative count of Article Views (full-text article views including HTML views, PDF and ePub downloads, according to the available data) and Abstracts Views on Vision4Press platform.
Data correspond to usage on the plateform after 2015. The current usage metrics is available 48-96 hours after online publication and is updated daily on week days.
Initial download of the metrics may take a while.