Fig. 1
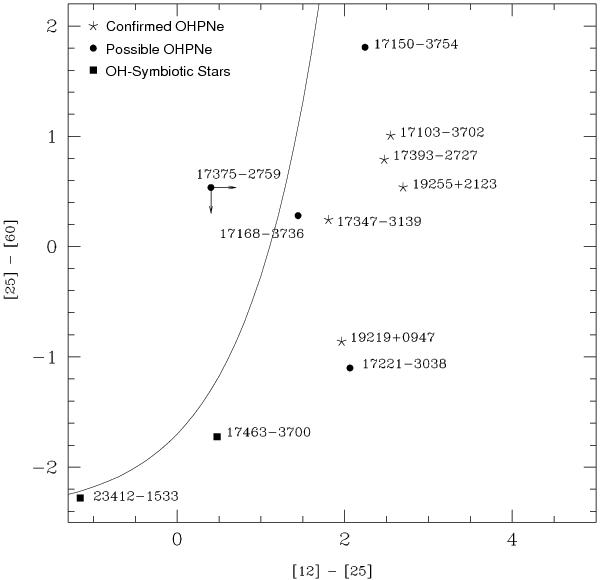
IRAS two-color diagram with the position of the confirmed and possible OHPNe, as well as of related objects, with which IRAS data could be associated. Asterisks represent the confirmed OHPNe, circles are the candidate OHPNe, and squares are symbiotic stars. The solid line is the curve modeled by Bedijn (1987) showing the location of AGB stars.
Current usage metrics show cumulative count of Article Views (full-text article views including HTML views, PDF and ePub downloads, according to the available data) and Abstracts Views on Vision4Press platform.
Data correspond to usage on the plateform after 2015. The current usage metrics is available 48-96 hours after online publication and is updated daily on week days.
Initial download of the metrics may take a while.