Fig. 2
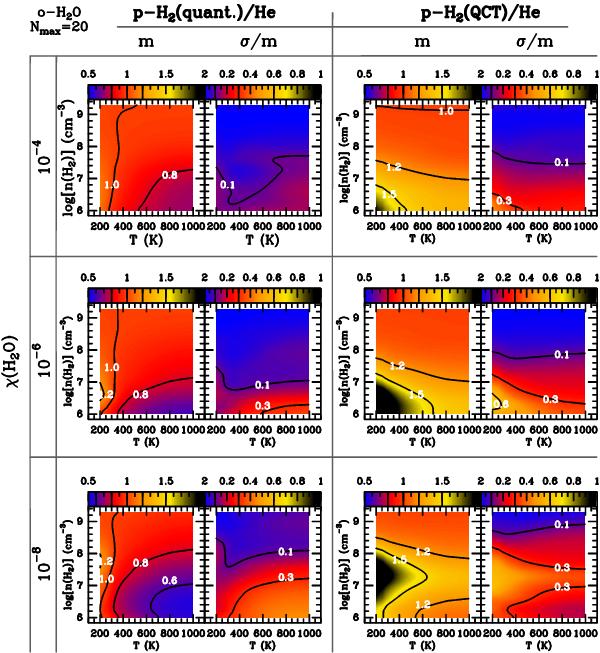
Comparison of the mean (m) and normalised standard deviations (σ/m, given by Eq. (4)) for the ratios  (left column) and
  (right column). The intensities
  are defined by Eq. (1). The statistical analysis is performed on the lines that involve the first Nmax = 20 o–H2O energy levels. The comparison deals with p–H2 CRC. The quantum CRC with p–H2 are from Dubernet et al. (2009) and Daniel et al. (2011), the quantum CRC with He from Green et al. (1993) and the QCT CRC are from Faure et al. (2007). In the case of the quantum CRC, the rates considered are the STS CRC with H2 in j2 = 0. The comparison is performed at the water abundances χ(H2O) = 10-8, 10-6, and 10-4 (rows).
Current usage metrics show cumulative count of Article Views (full-text article views including HTML views, PDF and ePub downloads, according to the available data) and Abstracts Views on Vision4Press platform.
Data correspond to usage on the plateform after 2015. The current usage metrics is available 48-96 hours after online publication and is updated daily on week days.
Initial download of the metrics may take a while.