Fig. 12
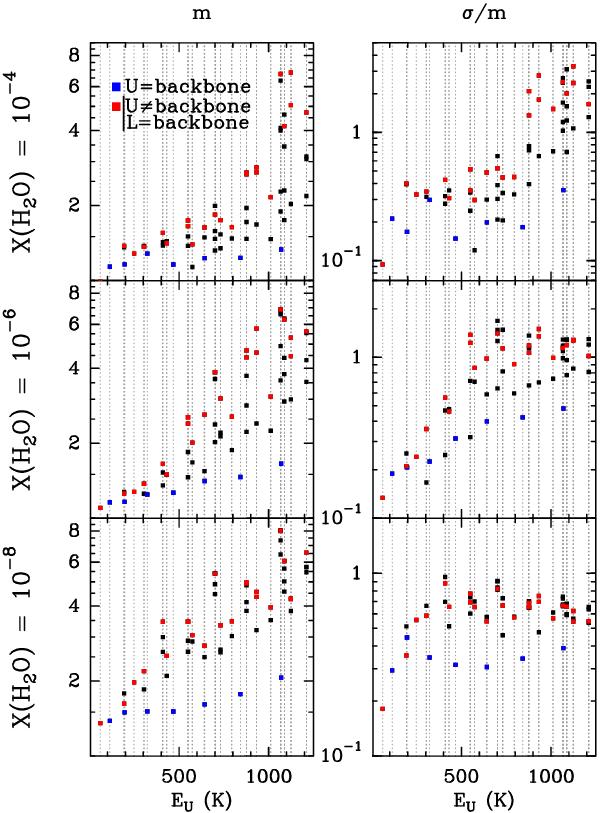
Mean value (left column) and normalised standard deviation (right column) for the  ratios as a function of the energy of the upper level of the radiative transitions. The intensities are obtained with the STS CRC Dubernet et al. (2009) and Daniel et al. (2011). The transitions that involve an upper energy level that is the backbone are indicated by blue points. The transitions where the upper level is not a backbone level while the lower level is backbone are indicated by red points.
Current usage metrics show cumulative count of Article Views (full-text article views including HTML views, PDF and ePub downloads, according to the available data) and Abstracts Views on Vision4Press platform.
Data correspond to usage on the plateform after 2015. The current usage metrics is available 48-96 hours after online publication and is updated daily on week days.
Initial download of the metrics may take a while.