Fig. 1
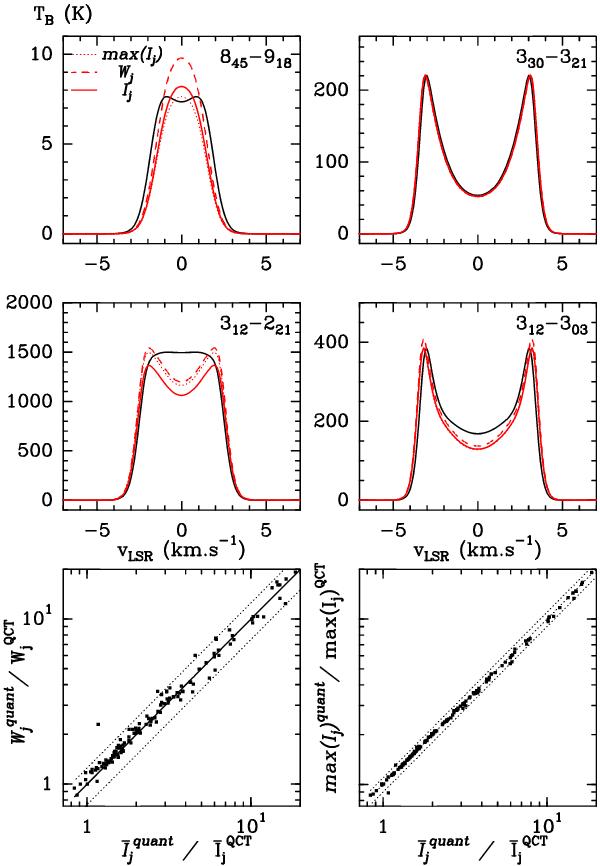
Comparison of the line intensity ratios based on three estimators:  , the integrated area Wj, or the peak intensity max(Ij) (see text for details). The four upper panels give the brightness temperature of a few o–H2O lines. The black curve corresponds to the profile obtained with the quantum CRC set and the red curves to the QCT CRC set (see text for details). In the latter case, the profile is scaled according to the ratios of (plain curve), Wj (dashed curve), or max(Ij) (dotted curve) so that the profiles that are plotted would correspond to a ratio of unity according to the three estimators. The two bottom panels represent the variations in the ratios obtained between the various indicators and for all the lines of the model.
Current usage metrics show cumulative count of Article Views (full-text article views including HTML views, PDF and ePub downloads, according to the available data) and Abstracts Views on Vision4Press platform.
Data correspond to usage on the plateform after 2015. The current usage metrics is available 48-96 hours after online publication and is updated daily on week days.
Initial download of the metrics may take a while.