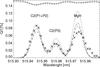
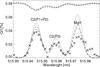
Fig. 1

Comparison of observed and computed I/Ic and − Q/I profiles at μ = 0.1 (upper panel), and at μ = 0.2 (lower panel). Left to right: (P1 + P2) C2 lines (at 515.946 nm), (P3) C2 line (at 515.960 nm), and MgH line (at 515.975 nm). The intensity profiles have been multiplied by a scaling number to fit in the same figures as the polarization rates. Plus symbols: observed intensity; full lines: computed intensity profiles. Cross symbols: observed Q/I spectrum. Dotted lines: polarization profiles computed with a depth-independent magnetic strength B = 12 G. Dashed lines: depth-independent magnetic strength B = 28 G. Dot-dashed lines: depth-independent magnetic strength B = 23 G
Current usage metrics show cumulative count of Article Views (full-text article views including HTML views, PDF and ePub downloads, according to the available data) and Abstracts Views on Vision4Press platform.
Data correspond to usage on the plateform after 2015. The current usage metrics is available 48-96 hours after online publication and is updated daily on week days.
Initial download of the metrics may take a while.