Fig. 12
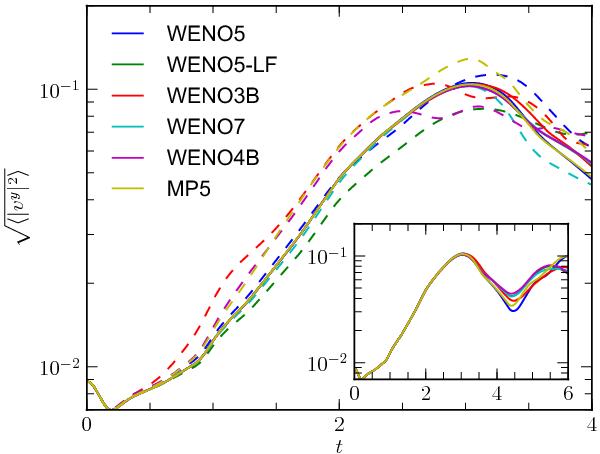
Rms value of the y-component of the velocity during the linear-growth phase of the 2D relativistic Kelvin-Helmholtz instability, for different numerical schemes. The solid lines represent the results obtained at the highest resolution, 1024 × 2048, while the dashed lines represent the results obtained at the lowest resolution, 128 × 256. The timestep is chosen so that the CFL factor is C ≈ 0.25 for all of the runs.
Current usage metrics show cumulative count of Article Views (full-text article views including HTML views, PDF and ePub downloads, according to the available data) and Abstracts Views on Vision4Press platform.
Data correspond to usage on the plateform after 2015. The current usage metrics is available 48-96 hours after online publication and is updated daily on week days.
Initial download of the metrics may take a while.