Fig. 7
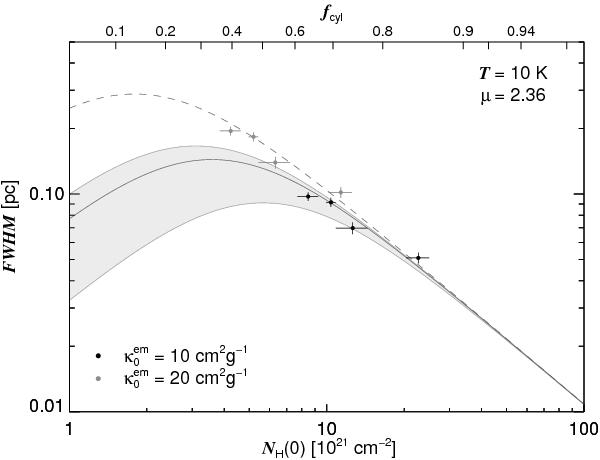
Relation between the FWHM and the central column density (Table 3, Cols. 4 and 6) for the four filaments in
IC 5146 if the filaments are placed at the
same distance D = 500 pc (black circles) closely consistent with
the assumed effective emission coefficient  and an assumed dust-to-gas ratio δ = 0.00588. For filaments b and d
the values correspond to the fit with constrained distance. The curves of the relation
shown are derived using the approximation (Eq. (32)) provided in Paper I. The grey shaded area shows the variation of the relation
for a range of external pressures implied by the observed sizes and column densities
of filaments in Polaris, IC 5146, and Aquila (Paper I). The external pressure is varied from 1.5 × 10⁴
to 5 × 10⁴ K cm-3 where for given central column density
the FWHM is larger for lower pressure. The given mass ratios on the upper axis
correspond to an external pressure 2 × 10⁴ K cm-3 shown as
the solid black curve. Also shown are the observed properties if the effective
emission coefficient is increased by a factor two (grey circles). The dashed curve
shows the model relation for
pext/k = 5 × 10³ K cm-3.
and an assumed dust-to-gas ratio δ = 0.00588. For filaments b and d
the values correspond to the fit with constrained distance. The curves of the relation
shown are derived using the approximation (Eq. (32)) provided in Paper I. The grey shaded area shows the variation of the relation
for a range of external pressures implied by the observed sizes and column densities
of filaments in Polaris, IC 5146, and Aquila (Paper I). The external pressure is varied from 1.5 × 10⁴
to 5 × 10⁴ K cm-3 where for given central column density
the FWHM is larger for lower pressure. The given mass ratios on the upper axis
correspond to an external pressure 2 × 10⁴ K cm-3 shown as
the solid black curve. Also shown are the observed properties if the effective
emission coefficient is increased by a factor two (grey circles). The dashed curve
shows the model relation for
pext/k = 5 × 10³ K cm-3.
Current usage metrics show cumulative count of Article Views (full-text article views including HTML views, PDF and ePub downloads, according to the available data) and Abstracts Views on Vision4Press platform.
Data correspond to usage on the plateform after 2015. The current usage metrics is available 48-96 hours after online publication and is updated daily on week days.
Initial download of the metrics may take a while.