Fig. 5
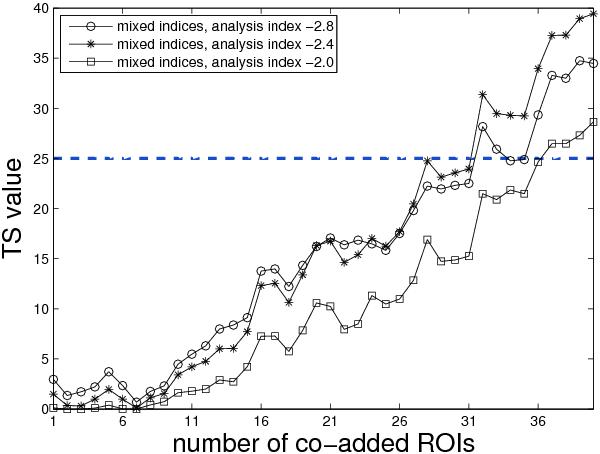
Test statistic values with respect to point-like emission at the center of the ROIs versus the number of co-added ROIs. The stacking is performed for a simulated source sample with mixed spectral shapes using analysis test sources with photon indices −2.0, −2.4 and −2.8. The detection threshold TS ≥ 25 is indicated by the dashed line.
Current usage metrics show cumulative count of Article Views (full-text article views including HTML views, PDF and ePub downloads, according to the available data) and Abstracts Views on Vision4Press platform.
Data correspond to usage on the plateform after 2015. The current usage metrics is available 48-96 hours after online publication and is updated daily on week days.
Initial download of the metrics may take a while.