Fig. 4
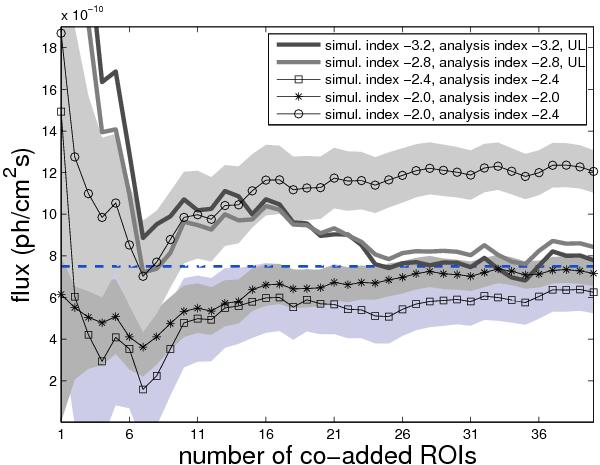
Integrated photon flux or 90% CL upper limit (UL) with respect to point-like emission at the center of the ROIs versus the number of co-added ROIs. The stacking is performed for simulated ROI samples that contain central sources with photon indices −2.0, −2.4, −2.8 and −3.2. For the analysis, power-law spectra are used that apply the same fixed photon indices as in the corresponding simulations. The stacking is also performed for ROIs that contain central sources with photon index −2.0 using a test source with photon index −2.4 in the analysis. The grey and blue shaded areas correspond to the statistical uncertainties on the integrated flux values. All central sources are simulated with an integrated flux of 7.5 × 10⁻¹⁰ ph/(cm2 s), indicated by the dashed line.
Current usage metrics show cumulative count of Article Views (full-text article views including HTML views, PDF and ePub downloads, according to the available data) and Abstracts Views on Vision4Press platform.
Data correspond to usage on the plateform after 2015. The current usage metrics is available 48-96 hours after online publication and is updated daily on week days.
Initial download of the metrics may take a while.