Fig. 10
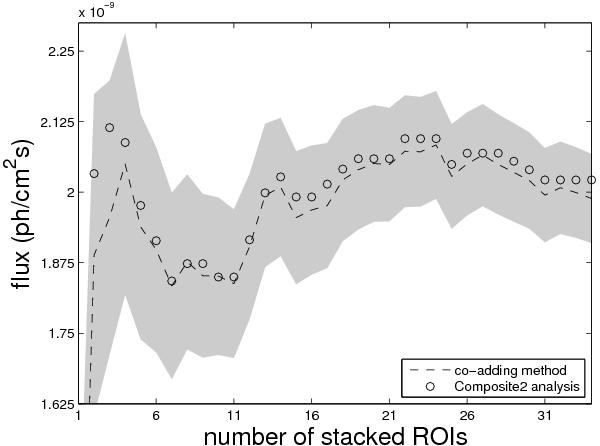
Integrated photon flux with respect to point-like emission at the center of the ROIs versus the number of co-added ROIs. The stacking is performed for Fermi-LAT detected point-like sources using the co-adding method (the grey shaded area corresponds to the statistical uncertainty). The results obtained with the Composite2 analysis are plotted for comparison.
Current usage metrics show cumulative count of Article Views (full-text article views including HTML views, PDF and ePub downloads, according to the available data) and Abstracts Views on Vision4Press platform.
Data correspond to usage on the plateform after 2015. The current usage metrics is available 48-96 hours after online publication and is updated daily on week days.
Initial download of the metrics may take a while.