Fig. 6
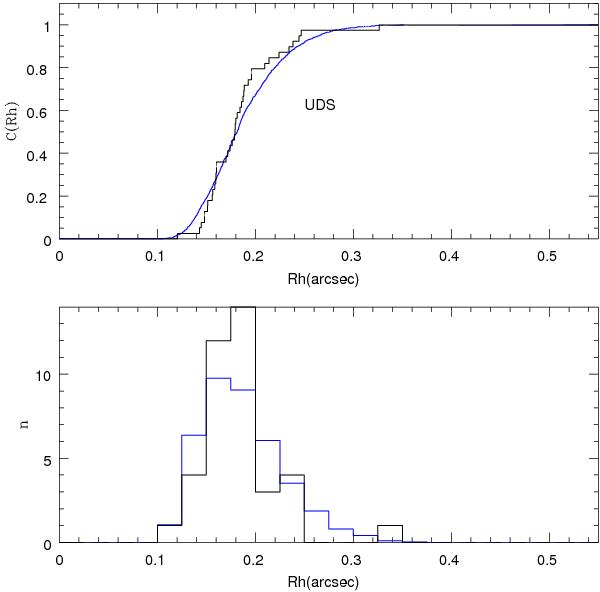
Best fit for the size distribution of the observed galaxies at z ~ 7 in the magnitude range 25.6 ≤ J ≤ 26.6 for the UDS field. Top: the cumulative distribution for the observed galaxy sizes (black histogram) is compared with the same for the simulated galaxies (blue curve), and a K-S p-value is computed. Bottom: the observed (black) and simulated histograms (blue), as described in the top panel, are compared with a Maximum Likelihood approach.
Current usage metrics show cumulative count of Article Views (full-text article views including HTML views, PDF and ePub downloads, according to the available data) and Abstracts Views on Vision4Press platform.
Data correspond to usage on the plateform after 2015. The current usage metrics is available 48-96 hours after online publication and is updated daily on week days.
Initial download of the metrics may take a while.