Fig. 5
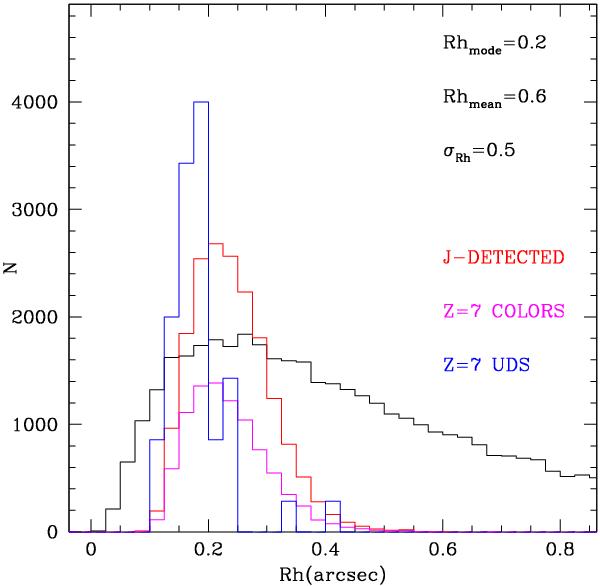
Size distributions of simulated and observed galaxies at z ~ 7 for the UDS field. The black histogram represents the input log-normal function with mean half light radius of 0.6 arcsec and a σRh of 0.5, resulting in a peak at 0.2 arcsec (mode). This is not the best fit for the observed size distribution, but only an example to show the effects of incompleteness at large half light radii. The input galaxies are simulated down to a magnitude of J = 26.7, which is the nominal limit for the UDS field. The red histogram is the size distribution of all galaxies detected in the J band UDS image, irrespectively of magnitudes and colors, while the magenta histogram shows only the galaxies at z ~ 7 selected by our color criteria. Last, the blue distribution represents the observed galaxy sizes in the UDS, scaled in normalization to match the number of simulated galaxies.
Current usage metrics show cumulative count of Article Views (full-text article views including HTML views, PDF and ePub downloads, according to the available data) and Abstracts Views on Vision4Press platform.
Data correspond to usage on the plateform after 2015. The current usage metrics is available 48-96 hours after online publication and is updated daily on week days.
Initial download of the metrics may take a while.