Fig. 4
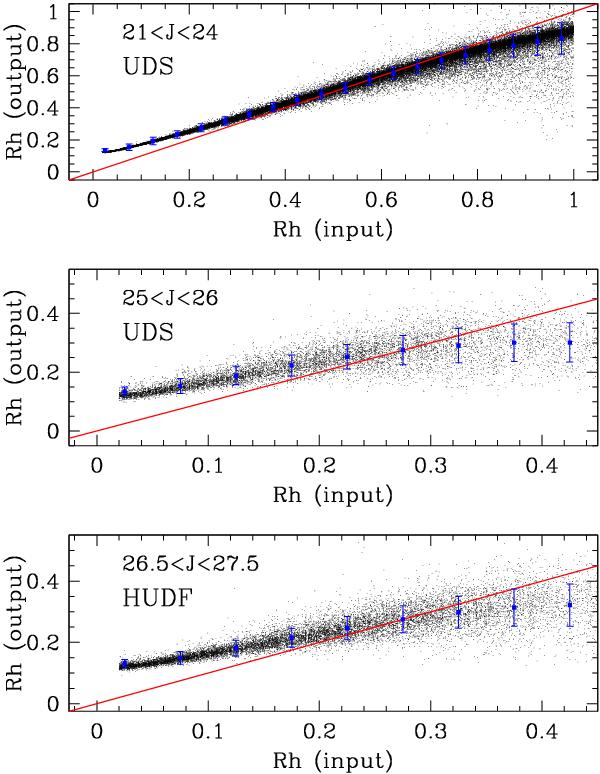
Results of our simulations for z ~ 7 galaxies with exponential disk profiles in the UDS and HUDF fields. The plot shows the comparison between the half-light radius (in arcsec) as measured by SExtractor as a function of the input one. The upper and lower panel refer to different total magnitudes in two different simulations, as reported in the legend. The red line shows the identity relation. The blue points and errorbars show the average value and the relevant rms of the output half-light radius. At small sizes the output half light radius is typically larger than the input one due to the convolution with the instrumental PSF carried out during the simulations. Note that the limits of the top panel are different from the ones in the middle and bottom panels.
Current usage metrics show cumulative count of Article Views (full-text article views including HTML views, PDF and ePub downloads, according to the available data) and Abstracts Views on Vision4Press platform.
Data correspond to usage on the plateform after 2015. The current usage metrics is available 48-96 hours after online publication and is updated daily on week days.
Initial download of the metrics may take a while.