Fig. 8
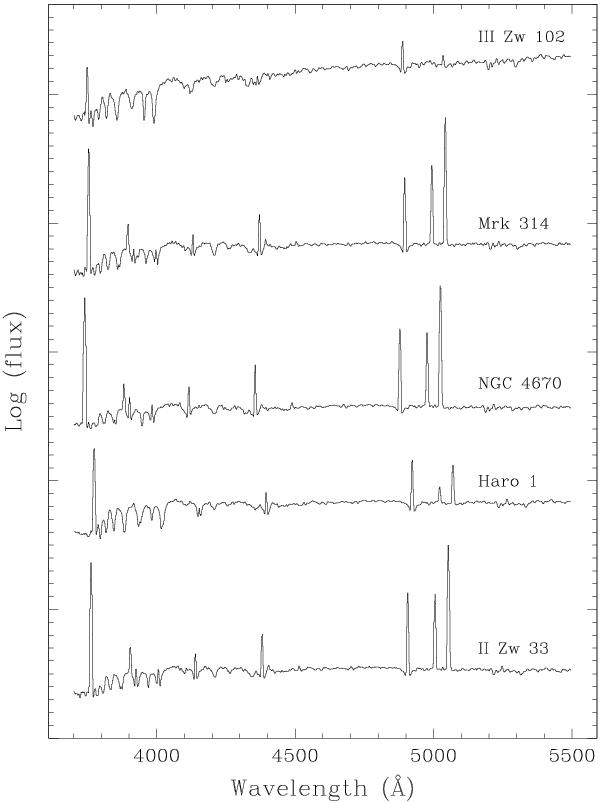
Integrated spectra of the sample galaxies, obtained by summing the spectra of all spaxels in which the stellar continuum could be fitted by a template (see Sect. 2.4). Spectra are plotted in logarithmic flux scale and were shifted vertically. Major tick-marks on the y axis are spaced 1 dex apart. Nuclear spectra do not exhibit significantly distinct features from the integrated spectra and are not shown.
Current usage metrics show cumulative count of Article Views (full-text article views including HTML views, PDF and ePub downloads, according to the available data) and Abstracts Views on Vision4Press platform.
Data correspond to usage on the plateform after 2015. The current usage metrics is available 48-96 hours after online publication and is updated daily on week days.
Initial download of the metrics may take a while.