Fig. 6
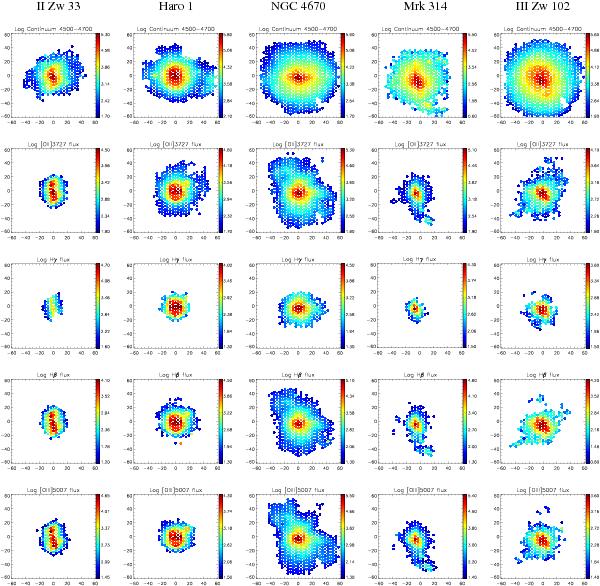
Observed intensity maps (not reddening-corrected). First row: continuum emission between 4500 and 4700 Å (a spectral region free from gas emission). Rows 2 to 5: emission-line flux maps derived from Gaussian fits to each line and spaxel (see text for details). Axis units are arcseconds; north is up, east to the left. All images are shown in logarithmic scale. Flux units are 10-18 erg cm-2 s-1. Spaxels where the blue Wolf-Rayet bump is visible are marked by stars in the [O iii] map.
Current usage metrics show cumulative count of Article Views (full-text article views including HTML views, PDF and ePub downloads, according to the available data) and Abstracts Views on Vision4Press platform.
Data correspond to usage on the plateform after 2015. The current usage metrics is available 48-96 hours after online publication and is updated daily on week days.
Initial download of the metrics may take a while.