Free Access
Fig. 3
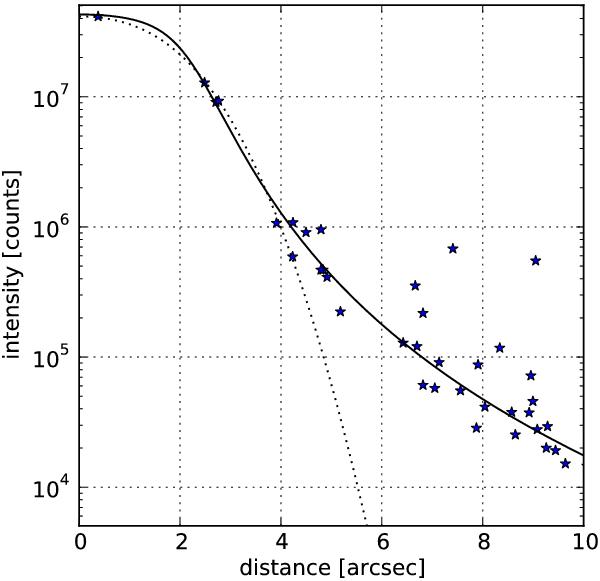
Measured and fitted intensity for the source G 191-B2B. The X-axis shows the distance to the fitted source center, Y the intensity. Stars indicate the positions of the fiber centers. The curves are the best Moffat (solid) and Gaussian (dotted) fits (both integrated over the fiber area).
Current usage metrics show cumulative count of Article Views (full-text article views including HTML views, PDF and ePub downloads, according to the available data) and Abstracts Views on Vision4Press platform.
Data correspond to usage on the plateform after 2015. The current usage metrics is available 48-96 hours after online publication and is updated daily on week days.
Initial download of the metrics may take a while.