Fig. 10
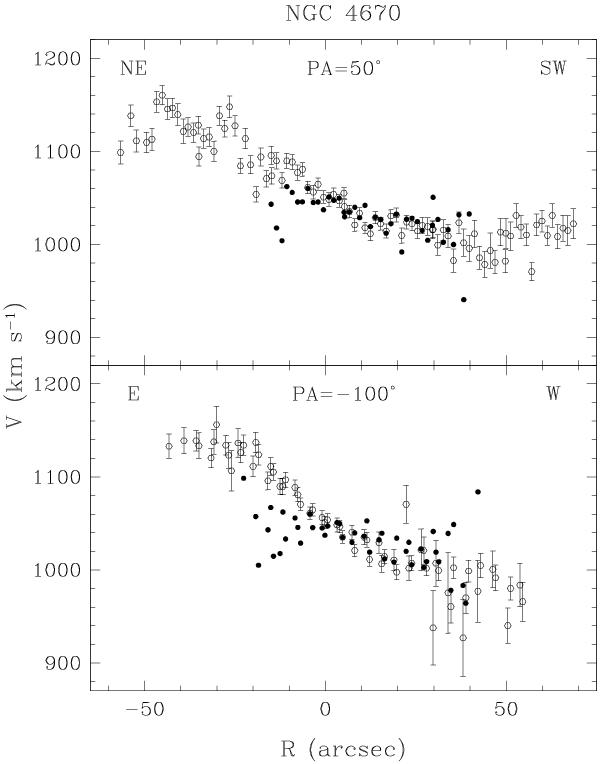
Upper panel: kinematical profile of NGC 4670 along a spatial cut through the reference point (0.0, 8.0) and PA = 50deg. The x axis is the distance of the projection of each spaxel on the above line to the reference point; only spaxels whose distance to the line is less than 6″ were selected and plotted. Lower panel: kinematical profile through the same point as above and PA = −100deg. Open points are [O iii] velocities, solid points are stellar velocities.
Current usage metrics show cumulative count of Article Views (full-text article views including HTML views, PDF and ePub downloads, according to the available data) and Abstracts Views on Vision4Press platform.
Data correspond to usage on the plateform after 2015. The current usage metrics is available 48-96 hours after online publication and is updated daily on week days.
Initial download of the metrics may take a while.