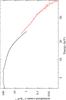
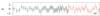
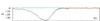
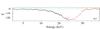
Fig. 3

Typical spectrum for an observation during the flaring phase of the giant outburst (obsid: 80067-11-03-05, Lx = 2.8 × 1037 erg s-1): in the upper panel, PCA and HEXTE data points and corresponding best fit are reported; below: residuals for the best fit a), the fit excluding the absorption feature at ~11 keV b), and the one excluding the CRSF c), respectively.
Current usage metrics show cumulative count of Article Views (full-text article views including HTML views, PDF and ePub downloads, according to the available data) and Abstracts Views on Vision4Press platform.
Data correspond to usage on the plateform after 2015. The current usage metrics is available 48-96 hours after online publication and is updated daily on week days.
Initial download of the metrics may take a while.