Fig. 6
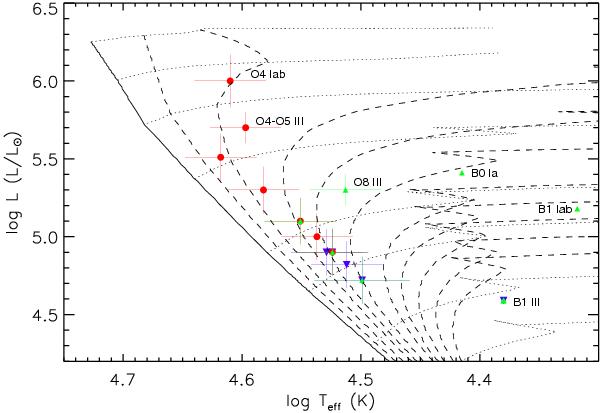
HR diagram showing the stellar populations of LH 66, LH 69, and NGC 2018 compared to the evolutionary tracks and isochrones of Schaller et al. (1992). LH 66 sources are indicated by the blue inverted triangles, LH 69 sources by the green triangles, and NGC 2018 sources by the red circles. The solid black line is the ZAMS isochrone with the dashed lines showing isochrones from 1−10 Myr in increments of 1 Myr. The dotted lines show the evolutionary tracks of stars with masses of (from top to bottom) 120 M⊙, 85 M⊙, 60 M⊙, 40 M⊙, 25 M⊙, 20 M⊙, 15 M⊙, and 12 M⊙. For clarity, we only show part of the evolutionary tracks of the most massive stars. We also omit the main-sequence B stars because they are unimportant in this age determination. The spectral types of the post-main sequence stars are also labelled to aid in the discussion. Uncertainties are unavailable for the B stars.
Current usage metrics show cumulative count of Article Views (full-text article views including HTML views, PDF and ePub downloads, according to the available data) and Abstracts Views on Vision4Press platform.
Data correspond to usage on the plateform after 2015. The current usage metrics is available 48-96 hours after online publication and is updated daily on week days.
Initial download of the metrics may take a while.