Fig. 5
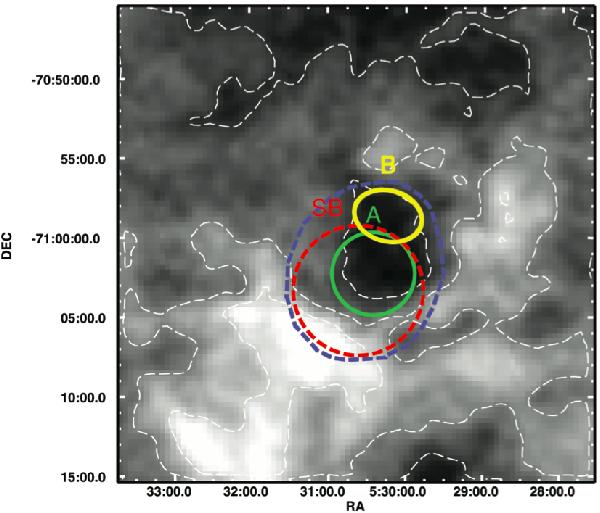
ATCA-Parkes 21 cm line map in the direction of N 206 from the H i Magellanic Cloud Survey. The superbubble emission regions (A and B) and superbubble boundaries (SB) are indicated. The contours correspond to 25%, 50%, and 75% of the peak emission. An additional region, shown here in blue, corresponds to the region from which we extracted the 21 cm line flux density for the analysis discussed in Sect. 4.3.2.
Current usage metrics show cumulative count of Article Views (full-text article views including HTML views, PDF and ePub downloads, according to the available data) and Abstracts Views on Vision4Press platform.
Data correspond to usage on the plateform after 2015. The current usage metrics is available 48-96 hours after online publication and is updated daily on week days.
Initial download of the metrics may take a while.