Fig. 3
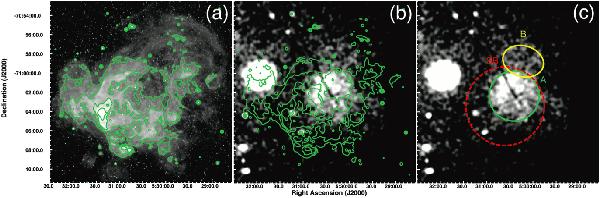
a) MCELS Hα image with contours. The lower contour limit has been adjusted to highlight the Hα shell that confines the X-ray emitting gas. The levels correspond to four logarithmically spaced intervals between this adjusted lower limit and the maximum pixel value. b) 0.3−1 keV XMM-Newton image with the Hα contours overlaid. c) 0.3−1 keV XMM-Newton image with superbubble emission regions indicated.
Current usage metrics show cumulative count of Article Views (full-text article views including HTML views, PDF and ePub downloads, according to the available data) and Abstracts Views on Vision4Press platform.
Data correspond to usage on the plateform after 2015. The current usage metrics is available 48-96 hours after online publication and is updated daily on week days.
Initial download of the metrics may take a while.