Fig. 9
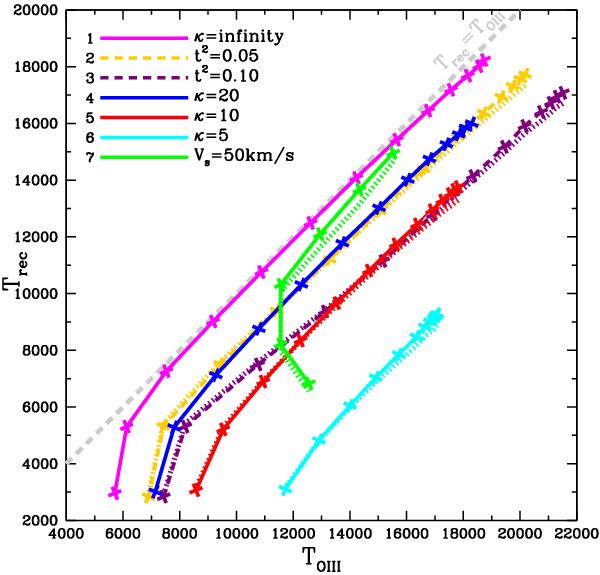
Recombination temperature  as a function of TO iii for various models. Along each sequence, only the metallicity varies. Solid and dashed lines are used to represent . A dotted line of the same color depicts
  , but it is plotted only for cases where differs from by more than 3%. The ionization parameter is always U = 0.01. In the case of the 50 km s-1 combined photoionization-shock model sequence (light green), Z assumes the values of 0.01 Z⊙, 0.10 Z⊙, 0.25 Z⊙ 0.49 Z⊙ 1.0 Z⊙, and 1.6 Z⊙ (the higher the metallicity, lower is Trec ). All other sequences cover the same metallicity range of 0.01 Z⊙ to 2.5 Z⊙, with a fixed increment of 0.2 dex between successive models. Three sequences represent κ-distributions (20, 10, or 5, see legend) and two sequences represent the case of temperature inhomogeneities (t2 = 0.05 or 0.10, see legend). The homogeneous pure photoionization sequence is represented by the magenta line (same as in Fig. 2).
Current usage metrics show cumulative count of Article Views (full-text article views including HTML views, PDF and ePub downloads, according to the available data) and Abstracts Views on Vision4Press platform.
Data correspond to usage on the plateform after 2015. The current usage metrics is available 48-96 hours after online publication and is updated daily on week days.
Initial download of the metrics may take a while.