Fig. 5
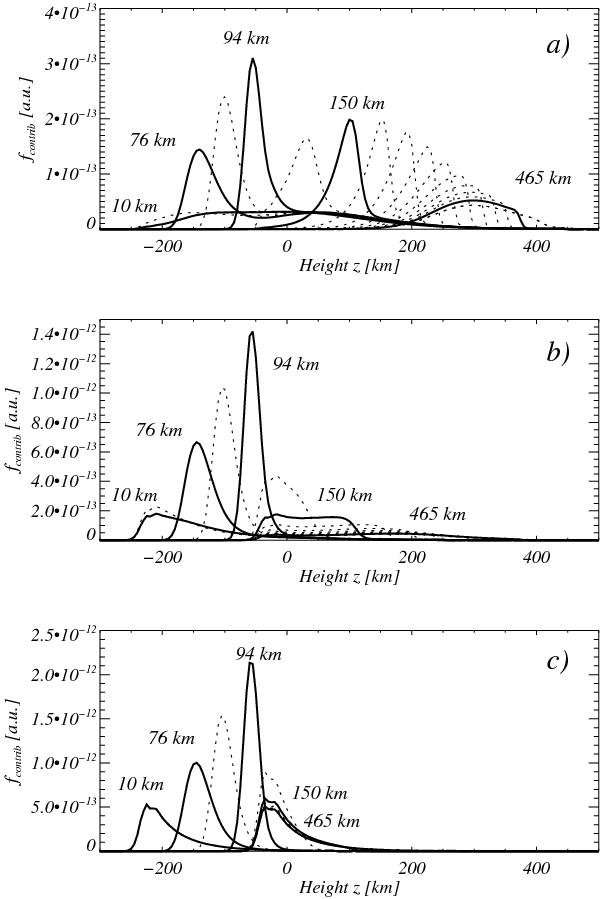
Contribution functions computed in 3D NLTE at different x-positions for the same three selected wavelengths of the 525.0 nm line as in Fig. 3: a) line core; b) line flank; c) continuum. The dotted contribution function is given for every tenth grid position corresponding to Δx ≈ 35 km, starting at 10 km from the plane of symmetry of the flux sheet. The five contribution functions corresponding to the same x-positions as the profiles shown in Fig. 4 are highlighted (solid lines) and indicated by their x-position. Note the very different shapes and positions of the individual curves.
Current usage metrics show cumulative count of Article Views (full-text article views including HTML views, PDF and ePub downloads, according to the available data) and Abstracts Views on Vision4Press platform.
Data correspond to usage on the plateform after 2015. The current usage metrics is available 48-96 hours after online publication and is updated daily on week days.
Initial download of the metrics may take a while.