Fig. 3
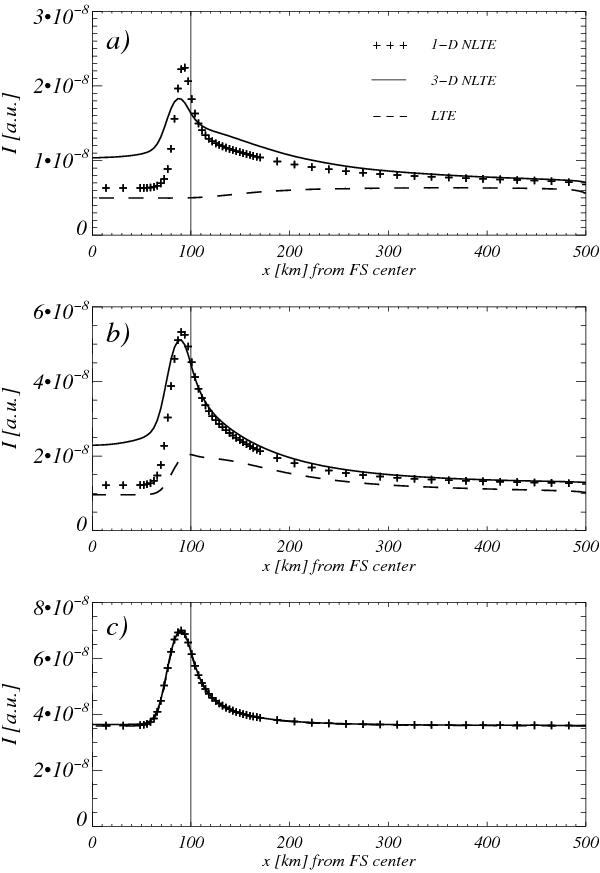
Intensities calculated with the different methods, indicated in the top panel, as a function of x position at three different wavelengths in the 525.0 nm line: a) line core; b) half depth (~0.004 nm); c) near continuum (~0.008 nm). The nominal FS boundary (R = 100 km at τc = 1) is indicated by the vertical line.
Current usage metrics show cumulative count of Article Views (full-text article views including HTML views, PDF and ePub downloads, according to the available data) and Abstracts Views on Vision4Press platform.
Data correspond to usage on the plateform after 2015. The current usage metrics is available 48-96 hours after online publication and is updated daily on week days.
Initial download of the metrics may take a while.