Fig. 19
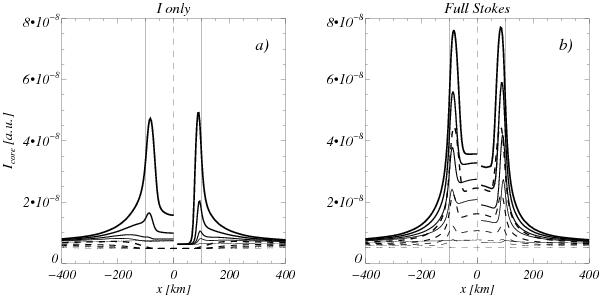
Influence of the magnetic field strength on the 525.0 nm line-core intensity. Three-dimensional NLTE (solid, right part of each panel), 1D (solid, left part of each panel), and LTE (dashed) for five different field strengths of 1700 G (highest curves, thicker), 1600 G (standard), 1500 G, 1400 G, and 1000 G (lowest curves, thinner) at z = 0 km. Panel a): intensities achieved when Zeeman splitting is neglected. Panel b): those obtained after including the Zeeman effect. Vertical lines indicate the FS boundary (solid) and FS center (dashed).
Current usage metrics show cumulative count of Article Views (full-text article views including HTML views, PDF and ePub downloads, according to the available data) and Abstracts Views on Vision4Press platform.
Data correspond to usage on the plateform after 2015. The current usage metrics is available 48-96 hours after online publication and is updated daily on week days.
Initial download of the metrics may take a while.