Fig. 13
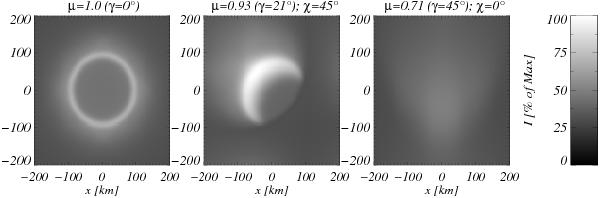
Intensity map of the 3D FT in the core of the 525.0 nm line for three different viewing directions as indicated on top of the panels. See Sect. 3.8 for definitions of γ and χ. The maximum intensity of the second image, showing the highest intensity values, was used to normalize the grayscale of all images.
Current usage metrics show cumulative count of Article Views (full-text article views including HTML views, PDF and ePub downloads, according to the available data) and Abstracts Views on Vision4Press platform.
Data correspond to usage on the plateform after 2015. The current usage metrics is available 48-96 hours after online publication and is updated daily on week days.
Initial download of the metrics may take a while.