Fig. 11
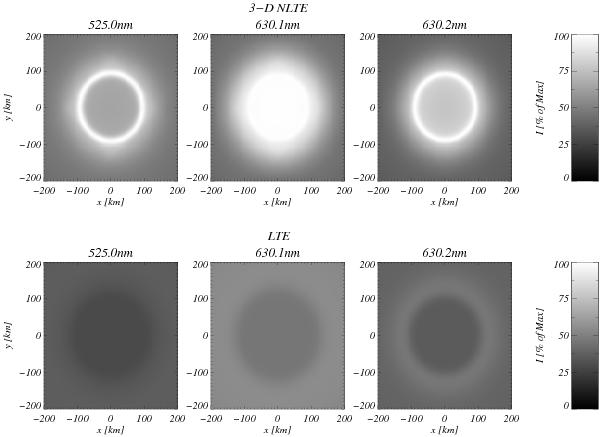
Intensity maps of a flux tube model in the cores of the three lines indicated above each panel. The grayscale for the 3D NLTE (upper panels) and LTE (lower panels) cases are the same within the pair of plots for a particular spectral line. The scale varies, however, from one spectral line to another between zero intensity and the maximum achieved in 3D NLTE (upper panels), which is set to 100%.
Current usage metrics show cumulative count of Article Views (full-text article views including HTML views, PDF and ePub downloads, according to the available data) and Abstracts Views on Vision4Press platform.
Data correspond to usage on the plateform after 2015. The current usage metrics is available 48-96 hours after online publication and is updated daily on week days.
Initial download of the metrics may take a while.