Fig. 7
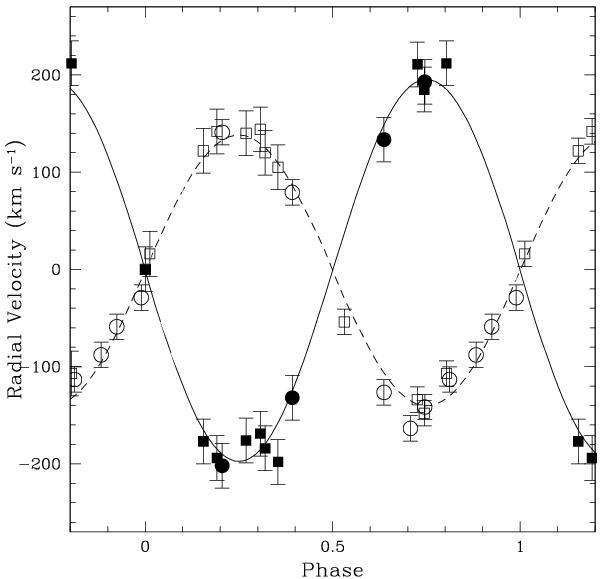
Radial velocity curve for W13. The measurements are shown as filled circles for the primary and open circles for the secondary; overplotted is the best-fit model from PHOEBE, denoted by a solid line for the primary and a dashed line for the secondary. The measurements from Ritchie et al. (2010) for the primary and secondary are denoted by filled and open squares, respectively. All radial velocities have been shifted to a systemic velocity of zero.
Current usage metrics show cumulative count of Article Views (full-text article views including HTML views, PDF and ePub downloads, according to the available data) and Abstracts Views on Vision4Press platform.
Data correspond to usage on the plateform after 2015. The current usage metrics is available 48-96 hours after online publication and is updated daily on week days.
Initial download of the metrics may take a while.