Fig. 13
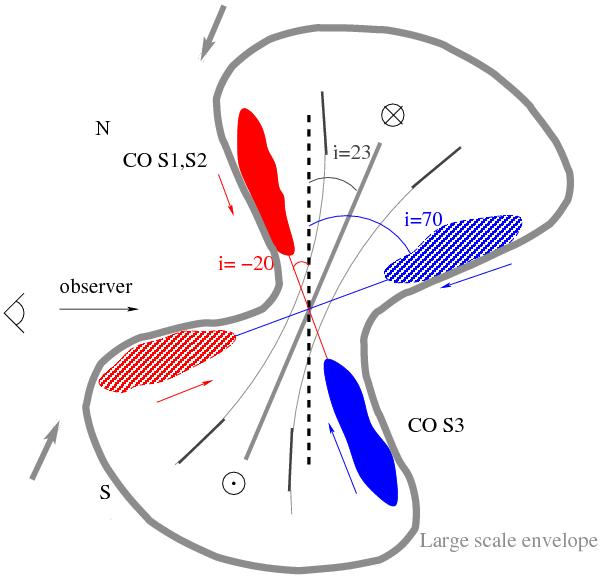
Illustration of the origin of the spiral emissions. The flared disk is plotted in gray segments and arcs. The solid filaments are the detected CO spirals. The hatched filaments with relatively larger inclination angles are not detected. The thick lines mark the large-scale, flattened, and tilted infalling envelope.
Current usage metrics show cumulative count of Article Views (full-text article views including HTML views, PDF and ePub downloads, according to the available data) and Abstracts Views on Vision4Press platform.
Data correspond to usage on the plateform after 2015. The current usage metrics is available 48-96 hours after online publication and is updated daily on week days.
Initial download of the metrics may take a while.