Fig. 11
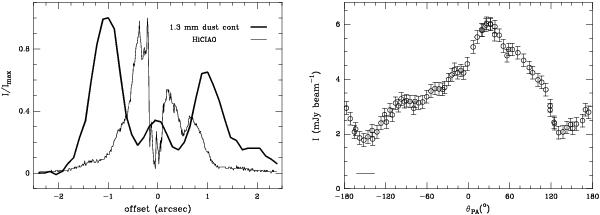
Left panel: plot of the normalized intensity of 1.3 mm continuum
and HiCIAO PI image at NIR along the major axis of the disk’s major axis. The
central 0 3 in HiCIAO data is occulted.
Right panel: plot of 1.3 mm intensity versus
θPA detected with the PdBI data of the best fit dust
ring, marked as a white ellipse in Fig. 1,
bottom right panel. The error bar is set to 0.23 mJy beam-1. The center
of the ellipse is on the 1.3 mm stellar peak. The horizontal bar at the
lower left corner marks the synthesized beam
(045).
3 in HiCIAO data is occulted.
Right panel: plot of 1.3 mm intensity versus
θPA detected with the PdBI data of the best fit dust
ring, marked as a white ellipse in Fig. 1,
bottom right panel. The error bar is set to 0.23 mJy beam-1. The center
of the ellipse is on the 1.3 mm stellar peak. The horizontal bar at the
lower left corner marks the synthesized beam
(045).
Current usage metrics show cumulative count of Article Views (full-text article views including HTML views, PDF and ePub downloads, according to the available data) and Abstracts Views on Vision4Press platform.
Data correspond to usage on the plateform after 2015. The current usage metrics is available 48-96 hours after online publication and is updated daily on week days.
Initial download of the metrics may take a while.