Fig. 1
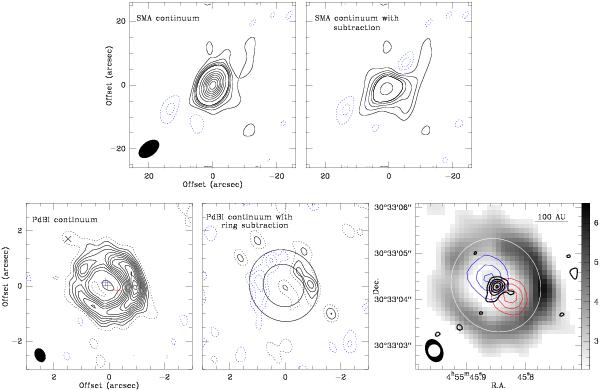
Continuum emission maps at 1.3 mm of the AB Aur region. Top panels:
larger scale image obtained from the SMA data (left panel) and the
residual image after removing the emission detected by the PdBI (right
panel). Contour levels are −2, 2, 4, 6, 8, 10 to 80 by 10 × 1 mJy per
7 4 ×
44 beam. Bottom panels:
higher angular resolution images obtained with the PdBI. Left panel:
the blue, red, and black pluses mark the peaks of CO 2-1 highest blue-shifted,
red-shifted peak, and the stellar location, respectively. The black cross marks the
northeast peak of the 1.3 mm continuum. The dotted contours mark the intensity of
2σI, where σI = 0.23 mJy per
052 ×
037 beam. Black contours start from
4σI in steps of 2σI.
Middle panel: residual emission from the PdBI after removal of a
best-fit smooth ring. The inner and outer radii are indicated. Contour levels are
multiples of 2σI. Right panel: the solid
white ellipse marks the 1.3 mm peak ring with a radius of 145 AU, i
of 23° and PA of −30° centered on the 1.3 mm stellar peak. The blue and red contours
mark the CO 2-1 emission starting from and stepping in 66 mJy per
056 ×
042 beam at the velocity channels of 2
and 9.3 km s-1, respectively. The 3.6 cm continuum emission are in thick
black contours at the level 3, 6, 9, 12, 15 × 9.3 μJy per
027 ×
026 beam. The synthesized beam of 1.3 mm
and 3.6 cm are labeled as black and white ellipses in the lower left corner,
respectively.
4 ×
44 beam. Bottom panels:
higher angular resolution images obtained with the PdBI. Left panel:
the blue, red, and black pluses mark the peaks of CO 2-1 highest blue-shifted,
red-shifted peak, and the stellar location, respectively. The black cross marks the
northeast peak of the 1.3 mm continuum. The dotted contours mark the intensity of
2σI, where σI = 0.23 mJy per
052 ×
037 beam. Black contours start from
4σI in steps of 2σI.
Middle panel: residual emission from the PdBI after removal of a
best-fit smooth ring. The inner and outer radii are indicated. Contour levels are
multiples of 2σI. Right panel: the solid
white ellipse marks the 1.3 mm peak ring with a radius of 145 AU, i
of 23° and PA of −30° centered on the 1.3 mm stellar peak. The blue and red contours
mark the CO 2-1 emission starting from and stepping in 66 mJy per
056 ×
042 beam at the velocity channels of 2
and 9.3 km s-1, respectively. The 3.6 cm continuum emission are in thick
black contours at the level 3, 6, 9, 12, 15 × 9.3 μJy per
027 ×
026 beam. The synthesized beam of 1.3 mm
and 3.6 cm are labeled as black and white ellipses in the lower left corner,
respectively.
Current usage metrics show cumulative count of Article Views (full-text article views including HTML views, PDF and ePub downloads, according to the available data) and Abstracts Views on Vision4Press platform.
Data correspond to usage on the plateform after 2015. The current usage metrics is available 48-96 hours after online publication and is updated daily on week days.
Initial download of the metrics may take a while.