Fig. 10
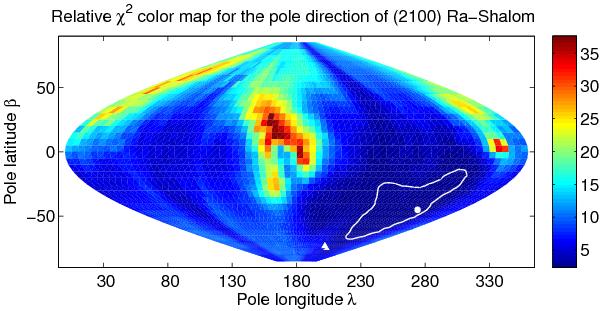
Statistical quality of Ra-Shalom pole solutions given in sinusoidal projection of the sky in ecliptic coordinates. The grade of shading and the scale bar on the right indicate the χ2 of the fit divided by the number of data points. The formally best-fit case with λ = 313° and β = − 45° is marked with a full circle. The solid line shows the contour with the χ2 value 8% higher than the minimum value of the best-fit solution. It represents our region of admissible solutions. The pole of the orbital plane corresponding to 180° obliquity, shown by the triangle, is located close to this zone.
Current usage metrics show cumulative count of Article Views (full-text article views including HTML views, PDF and ePub downloads, according to the available data) and Abstracts Views on Vision4Press platform.
Data correspond to usage on the plateform after 2015. The current usage metrics is available 48-96 hours after online publication and is updated daily on week days.
Initial download of the metrics may take a while.