Fig. 8
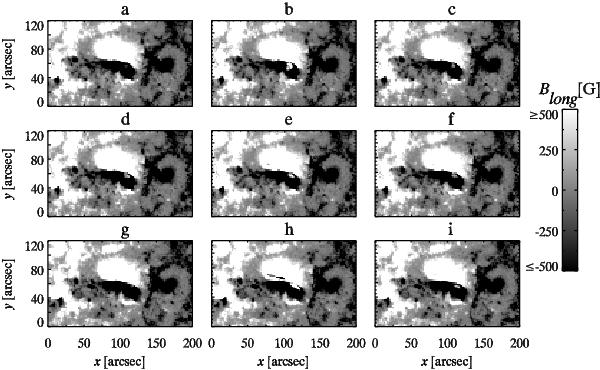
MDI magnetograms during flares i, iii, and v. The images are all clipped to the same maximum and minimum of ± 500 G. The observation times are indicated by the vertical lines in Fig. 9 corresponding to the letters a) to i). Upper row [a), b), c)]: the first panel shows the sunspot before flare i. Panel two was taken during the rising phase of flare i and panel c after the flare SXR peak. Middle row [d), e), f)]: magnetograms before flare iii, during the rising phase of the flare and after. Lower row: [g), h), i)]: magnetograms showing the sunspot this time before flare v, during the rising phase of the flare and again after.
Current usage metrics show cumulative count of Article Views (full-text article views including HTML views, PDF and ePub downloads, according to the available data) and Abstracts Views on Vision4Press platform.
Data correspond to usage on the plateform after 2015. The current usage metrics is available 48-96 hours after online publication and is updated daily on week days.
Initial download of the metrics may take a while.