Fig. 6
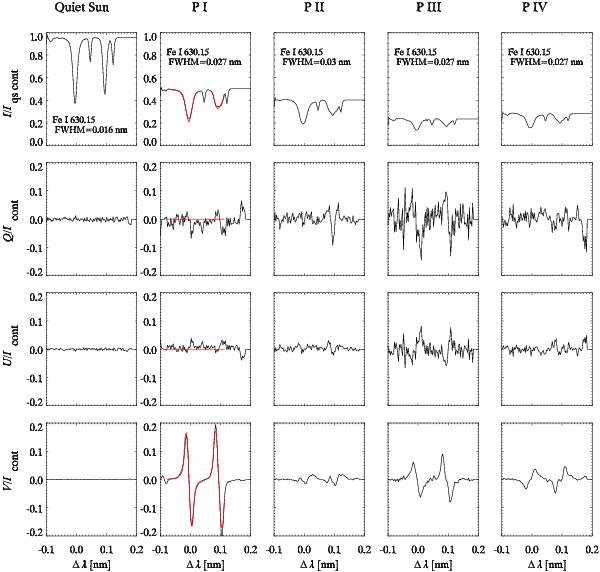
Quiet-Sun profile and Stokes profiles retrieved from the positions P i to P iv marked in Fig. 4. The columns show Stokes I with the two Fe i 630 nm lines and two telluric oxygen lines normalized to an averaged quiet-Sun Stokes I continuum to demonstrate the continuum intensity differences and Stokes Q, U and V profiles normalized to the local Stokes I continuum to show the differences in scales between the polarization signals. The wavelength scale is given in Δ λ from the Fe i 630.15 nm rest wavelength position. The full-width at half-maximum is given for the Fe i 630.15 nm line. The red curve overplotted on the profiles located at P I denotes synthesized profiles fitted to the observations by the inversion code. The magnetic and velocity field values at log (τ500 nm = -1) corresponding to this fit are B = 2.1 kG with an inclination angle of γ = 25 ° and a velocity of vLOS = −1.5 km s-1.
Current usage metrics show cumulative count of Article Views (full-text article views including HTML views, PDF and ePub downloads, according to the available data) and Abstracts Views on Vision4Press platform.
Data correspond to usage on the plateform after 2015. The current usage metrics is available 48-96 hours after online publication and is updated daily on week days.
Initial download of the metrics may take a while.