Fig. 5
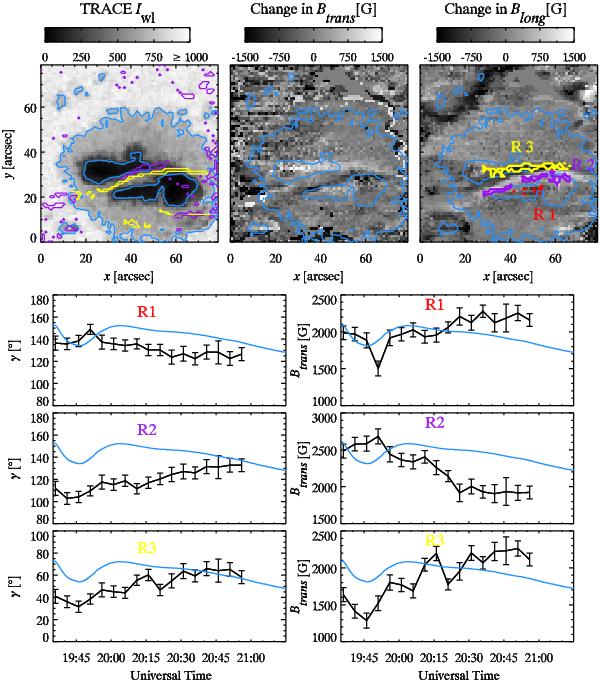
Top row: TRACE whitelight image. Purple contours show areas with changes in the magnetic field azimuth larger than 5° and yellow contours are areas in which the longitudinal magnetic field switches from a positive sign to a negative sign or the other way around. All values are retrieved through the inversion and are selected at optical depth log(τ500 nm) = -1. The second and third panels show the change in Btrans and Blong. White areas are regions of increase in Btrans/Blong and areas of decrease are black. R1 (red contour), R2 (purple contour), and R3 (yellow contour) in the last panel are locations of simultaneous change in Btrans and Blong greater than 400 G in both parameters. Last three rows: average inclination angle γ and the average Btrans in the regions R1, R2, and R3. As in Fig. 4, the inclination angle runs from 0° to 180° with γ = 90 °, representing a transversal magnetic field and an angle of γ > 90 °, constituting a negative longitudinal magnetic field (vector pointing toward the Sun). The error bars are the standard deviation in γ and Btrans over a region in the umbra outside the flare site. The soft X-ray GOES curve is overlaid in blue.
Current usage metrics show cumulative count of Article Views (full-text article views including HTML views, PDF and ePub downloads, according to the available data) and Abstracts Views on Vision4Press platform.
Data correspond to usage on the plateform after 2015. The current usage metrics is available 48-96 hours after online publication and is updated daily on week days.
Initial download of the metrics may take a while.