Fig. 4
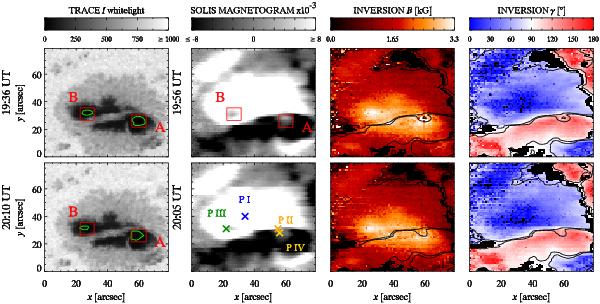
Umbral region of NOAA 10808, before and after flare iii. Top row: the TRACE whitelight intensity image on the left side in the upper row was recorded at 19:36 and rotated and scaled to the SOLIS-VSM data. The green contours are locations where the continuum intensity is below ~20% of the quiet Sun continuum. These regions marked as A and B are also locations of low polarization signals. The second panel in the upper row is the SOLIS magnetogram that was obtained from the Stokes V profiles (see main text for details) recorded at about 19:56 UT. The last two panels, magnetic field strength in kG and inclination angle γ, are the result of LILIA inversions of the SOLIS-VSM full Stokes profiles recorded around 19:56 UT at optical depth log (τ500 nm) = -1. The inclination angle is shown in degrees, with a magnetic field vector along the line of sight pointing out of the solar surface with an inclination angle of 0° . The black lines are contours obtained by choosing cutoff levels of 0.002 and −0.002 for the magnetogram. The black areas in the inversion results are uninverted pixels. The noise produced by the deteriorating polarization modulator propagates into the inversion results. Bottom row: the first panel shows the TRACE whitelight image at 20:10 UT. The last three panels in the lower row are the magnetogram and the inversion results obtained from SOLIS data recorded around 20:05 UT. The Stokes profiles found at locations P i to P iv are discussed in Sect. 3.2.
Current usage metrics show cumulative count of Article Views (full-text article views including HTML views, PDF and ePub downloads, according to the available data) and Abstracts Views on Vision4Press platform.
Data correspond to usage on the plateform after 2015. The current usage metrics is available 48-96 hours after online publication and is updated daily on week days.
Initial download of the metrics may take a while.