Fig. 1
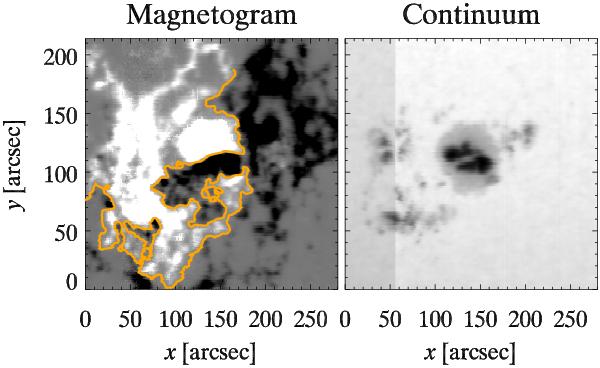
Active region NOAA 10808 on September 13, 2005. Left: magnetogram obtained from SOLIS-VSM Stokes V profile amplitudes in the Fe i 630.25 nm line. The white areas denote positive magnetic flux, while the black areas are regions exhibiting negative magnetic flux. The orange line shows the intricate polarity inversion line (PIL). Right: co-spatial intensity image constructed from the Stokes I continuum intensities.
Current usage metrics show cumulative count of Article Views (full-text article views including HTML views, PDF and ePub downloads, according to the available data) and Abstracts Views on Vision4Press platform.
Data correspond to usage on the plateform after 2015. The current usage metrics is available 48-96 hours after online publication and is updated daily on week days.
Initial download of the metrics may take a while.