Fig. 8
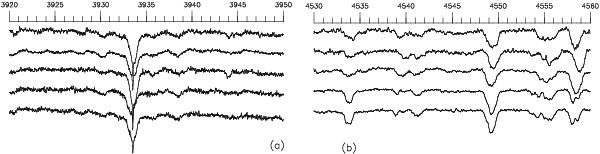
Line-profile changes in the UV region a) and in the blue region b) of HR 6878, as revealed by the five respective spectra for those wavelength regions listed in Table 2. In a) the second, third and fourth spectra were observed on consecutive nights, while in b) the first two spectra were separated by an interval of 6 days, and the third and fourth by an interval of 2 days; all the other intervals were substantially longer. The spectra in b) were smoothed by a 9-point function in order to reveal the changes more clearly.
Current usage metrics show cumulative count of Article Views (full-text article views including HTML views, PDF and ePub downloads, according to the available data) and Abstracts Views on Vision4Press platform.
Data correspond to usage on the plateform after 2015. The current usage metrics is available 48-96 hours after online publication and is updated daily on week days.
Initial download of the metrics may take a while.