Fig. 7
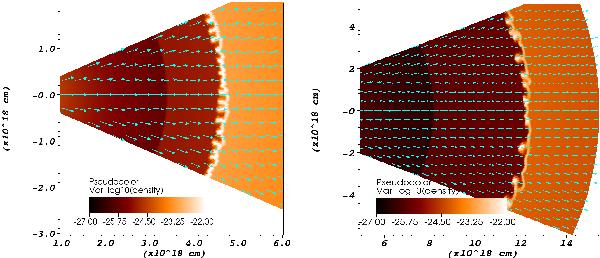
The WR-LBV interaction in low resolution. This figure shows the density in cgs. as well as the velocity field for simulation B1 after 4010 and 11 800 years. In the left panel, the shell mainly shows small Vishniac instabilities. In the right panel, some evidence of RT instabilities is visible, but unlike for the WR-RSG interaction (Figs. 3 and 4), they are small compared to the size of the shell.
Current usage metrics show cumulative count of Article Views (full-text article views including HTML views, PDF and ePub downloads, according to the available data) and Abstracts Views on Vision4Press platform.
Data correspond to usage on the plateform after 2015. The current usage metrics is available 48-96 hours after online publication and is updated daily on week days.
Initial download of the metrics may take a while.