Fig. 5
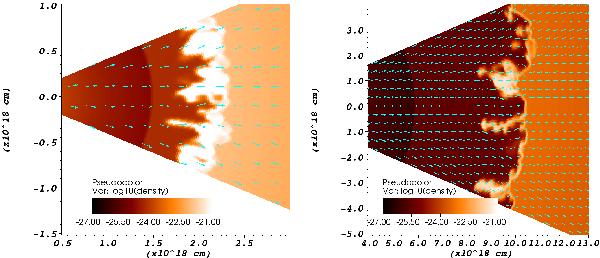
3D simulation the WR-RSG interaction in low resolution (A3). From left to right: density in cgs of the CSM after 7920 and 39 200 years. This figure shows slices through the 3D grid. These results closely resemble Fig. 3, which has the same resolution in 2D. However, the instabilities in the 3D model are more pronounced than in 2D and develop quicker.
Current usage metrics show cumulative count of Article Views (full-text article views including HTML views, PDF and ePub downloads, according to the available data) and Abstracts Views on Vision4Press platform.
Data correspond to usage on the plateform after 2015. The current usage metrics is available 48-96 hours after online publication and is updated daily on week days.
Initial download of the metrics may take a while.