Fig. 4
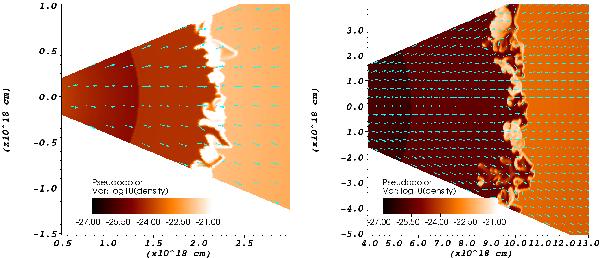
Similar to Fig. 3, but for simulation A2, which has twice the resolution. Initially, the difference with the low resolution run is small. The RT instabilities in the right panel are smaller than their counterparts in Fig. 3 and show more structure. Parts of the RT fingers are breaking off and will eventually dissolve in the shocked WR wind bubble that is driving the shell.

Current usage metrics show cumulative count of Article Views (full-text article views including HTML views, PDF and ePub downloads, according to the available data) and Abstracts Views on Vision4Press platform.
Data correspond to usage on the plateform after 2015. The current usage metrics is available 48-96 hours after online publication and is updated daily on week days.
Initial download of the metrics may take a while.