Fig. 13
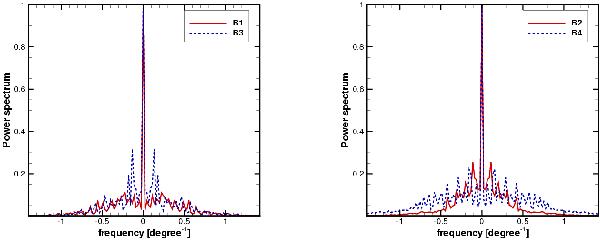
Similar to Fig. 12, but for the final results of simulations B1 and B3 (left panel) and B2 and B4 (right panel). As for the WR-RSG interaction, the higher resolution models tend to show more higher order maxima and the 3D models have higher peaks corresponding to the instabilities. The power spectrum of simulation B3 shows a peak at about 0.05 per latitudinal angle, which corresponds to the single large instability.
Current usage metrics show cumulative count of Article Views (full-text article views including HTML views, PDF and ePub downloads, according to the available data) and Abstracts Views on Vision4Press platform.
Data correspond to usage on the plateform after 2015. The current usage metrics is available 48-96 hours after online publication and is updated daily on week days.
Initial download of the metrics may take a while.