Fig. 12
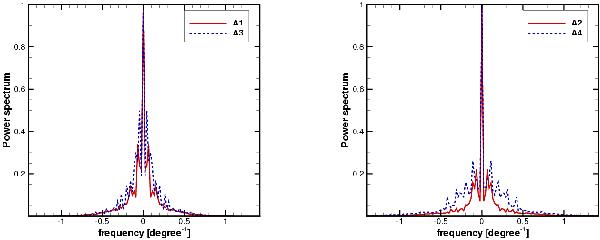
Power spectrum calculated from a 1D Fourier transform along the latitudinal axis for the final results of simulations A1 and A3, being 2D vs. 3D (left panel) and their equivalents at higher resolution, A2 and A4 (right panel). All simulations show a peak at about 0.8 per latitudinal degree, corresponding to the large RT instabilities. The higher resolution simulations (A2 and A4) show more high order maxima than the low resolution models. Also, the peaks corresponding to instabilities tend to be higher with respect to the zero-th order peak for the 3D simulations than for the 2D models.
Current usage metrics show cumulative count of Article Views (full-text article views including HTML views, PDF and ePub downloads, according to the available data) and Abstracts Views on Vision4Press platform.
Data correspond to usage on the plateform after 2015. The current usage metrics is available 48-96 hours after online publication and is updated daily on week days.
Initial download of the metrics may take a while.