Free Access
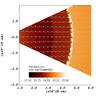
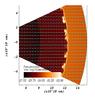
Fig. 10
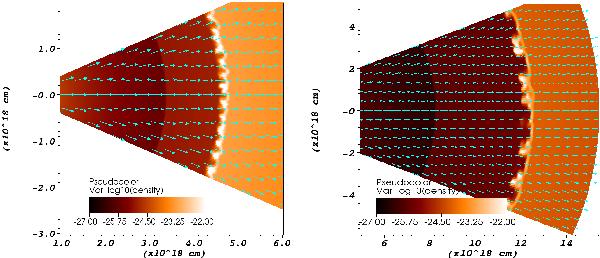
Slices through the 3D simulation of the WR-LBV interaction in low resolution (B3). From left to right: density in cgs of the CSM at 4010, 7920 and 11 800 years. These results closely resemble Fig. 7, which has the same resolution in 2D.
This figure is made of several images, please see below:
Current usage metrics show cumulative count of Article Views (full-text article views including HTML views, PDF and ePub downloads, according to the available data) and Abstracts Views on Vision4Press platform.
Data correspond to usage on the plateform after 2015. The current usage metrics is available 48-96 hours after online publication and is updated daily on week days.
Initial download of the metrics may take a while.