Fig. 6
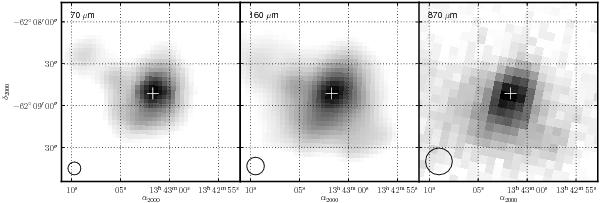
The 70 and 160 μm images obtained from the Hi-GAL survey with the Herschel Space Observatory, and the 870 μm image from the ATLASGAL survey with the APEX telescope. The circle in the lower left corner of each image indicates the beam size. The two Hi-GAL images are shown with logarithmic scaling of the intensity, while the ATLASGAL image is shown with linear scaling.
Current usage metrics show cumulative count of Article Views (full-text article views including HTML views, PDF and ePub downloads, according to the available data) and Abstracts Views on Vision4Press platform.
Data correspond to usage on the plateform after 2015. The current usage metrics is available 48-96 hours after online publication and is updated daily on week days.
Initial download of the metrics may take a while.