Fig. 9
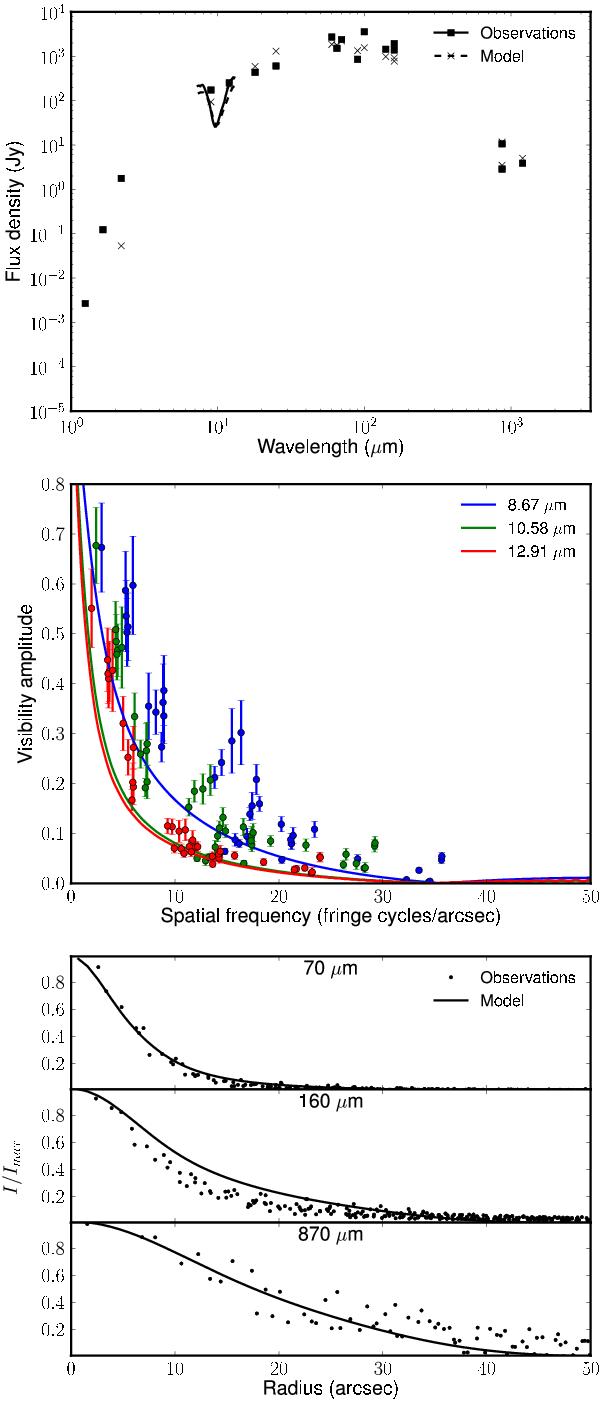
Model fits of the observational data for the near model. Top: the SED, where the aperture-corrected model flux levels are shown as crosses and the dotted line, and the observed flux values are shown as filled squares and the solid line. Middle: the modeled (lines) and observed (points) MIDI visibilities for three wavelengths. Bottom: the modeled (blue points) and observed (green points) radial intensity distributions from the Hi-GAL (70 and 160 μm) and ATLASGAL (870 μm) images.
Current usage metrics show cumulative count of Article Views (full-text article views including HTML views, PDF and ePub downloads, according to the available data) and Abstracts Views on Vision4Press platform.
Data correspond to usage on the plateform after 2015. The current usage metrics is available 48-96 hours after online publication and is updated daily on week days.
Initial download of the metrics may take a while.