Fig. 1
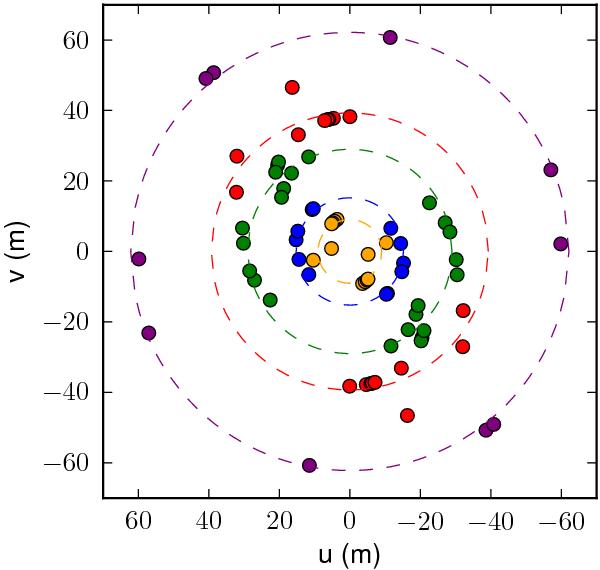
uv coverage of MIDI observations. North is up, east is left. The positions have been color–coded by projected baseline length, and the dashed lines indicate the mean projected baselines for each color (orange – 8.1 m; blue – 15.2 m; green – 28.5 m; red – 42.5 m; purple – 61.7 m).
Current usage metrics show cumulative count of Article Views (full-text article views including HTML views, PDF and ePub downloads, according to the available data) and Abstracts Views on Vision4Press platform.
Data correspond to usage on the plateform after 2015. The current usage metrics is available 48-96 hours after online publication and is updated daily on week days.
Initial download of the metrics may take a while.